Problem: Given 3 surfaces find the point where they intersect by solving the linear system and display the solution.
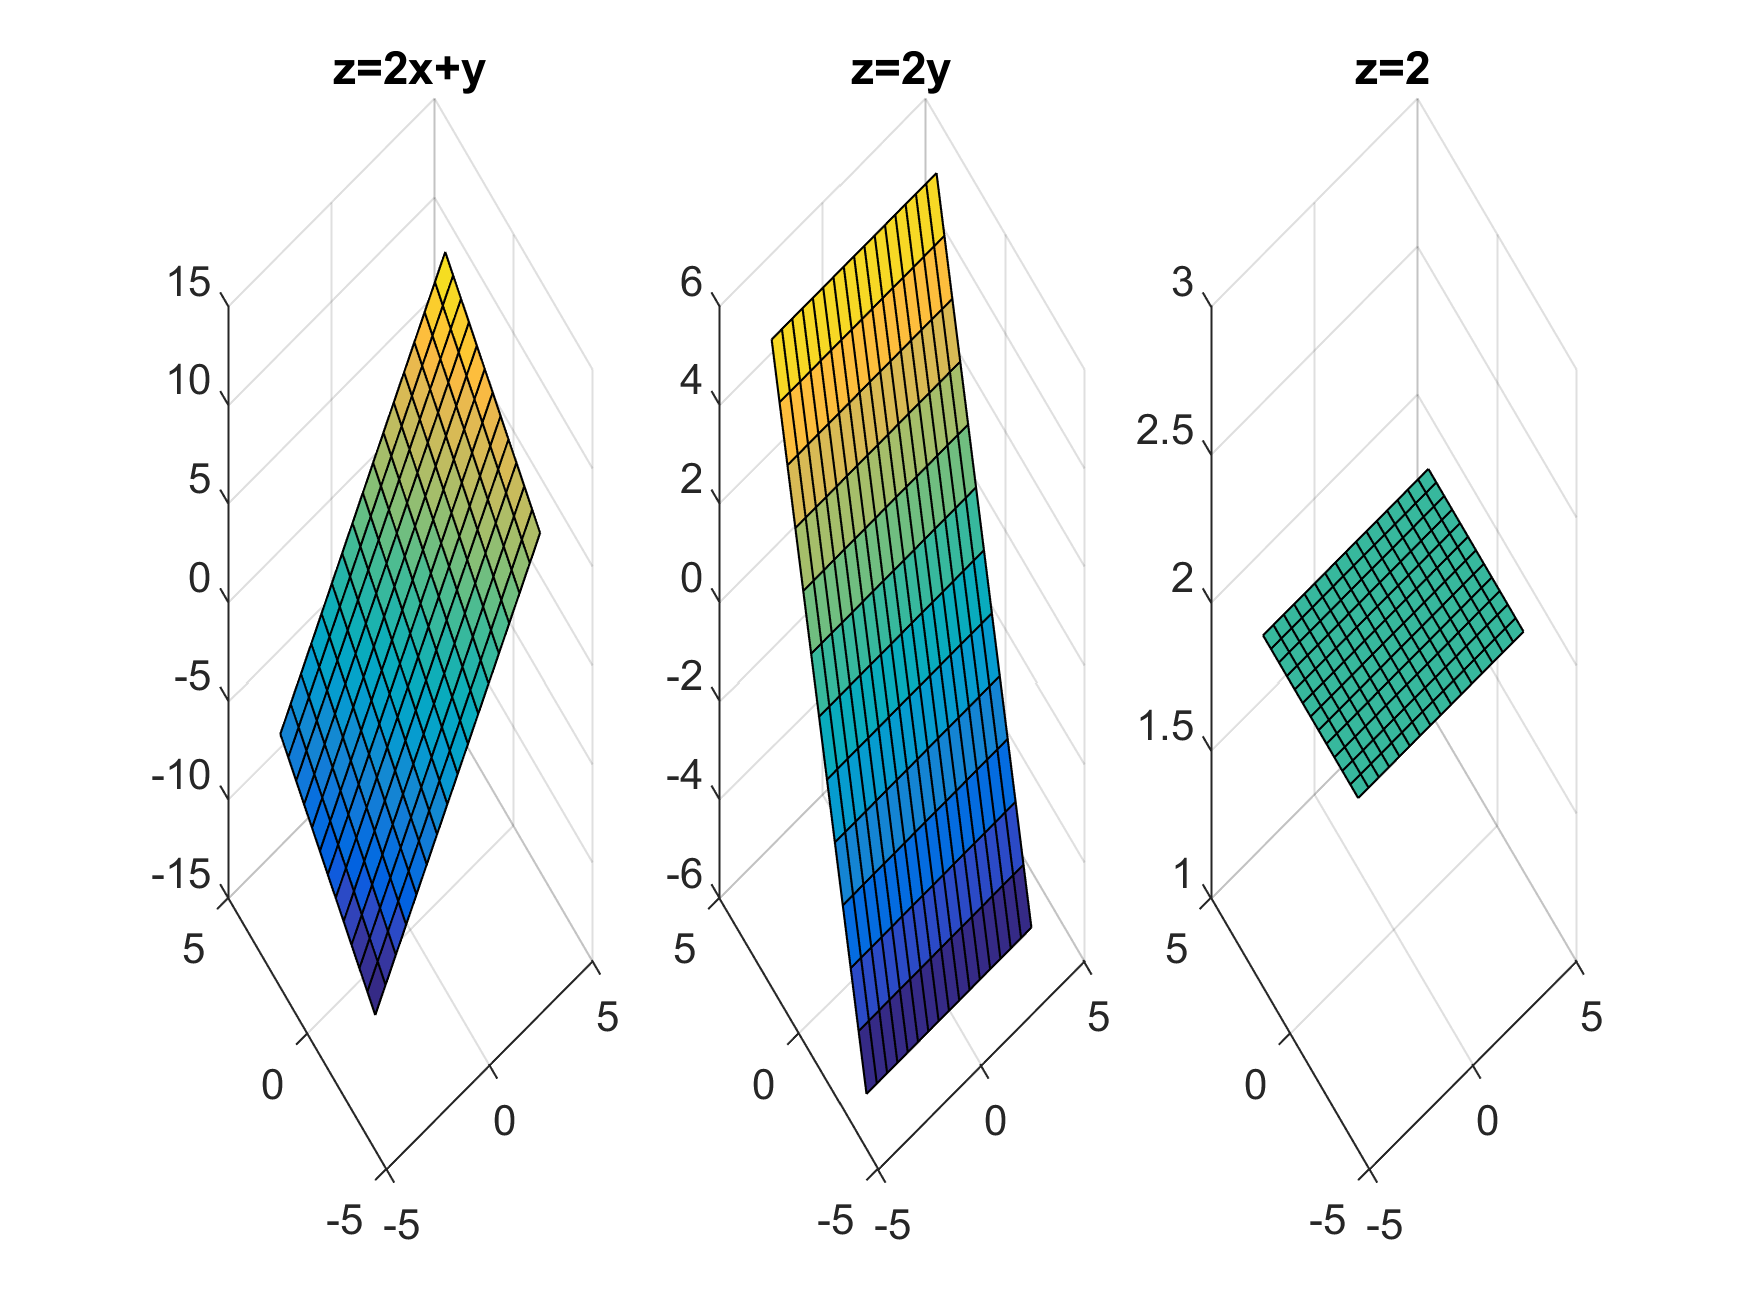
Let the 3 surfaces be \begin {align*} z & =2x+y\\ z & =2y\\ z & =2 \end {align*}
In Mathematica, plot the surfaces using the Plot3D command, and then use LinearSolve to solve the system of equations in order to find point of intersection, then use ScatterPlot to plot the point solution. In Matlab, use surf command to do the plotting, and solve the system of equations using Matlab
Mathematica
Remove["Global`*"];
eq1 = z-2x-y ==0;
eq2 = z-2y ==0;
eq3 = z- 2 ==0;
p1 = ContourPlot3D[Evaluate@eq1,
         {x,-5,5},{y,-5,5},{z,-10,10},
         AxesLabel->{"x","y","z"},
         PlotLabel->"z=2x+y",
         ImageSize->250];
p2 = ContourPlot3D[Evaluate@eq2,
        {x,-5,5},{y,-5,5},{z,-10,10},
        AxesLabel->{"x","y","z"},
        PlotLabel->"z=2x",
        ImageSize->250];
p3 = ContourPlot3D[Evaluate@eq3,
        {x,-5,5},{y,-5,5},{z,-10,10},
        AxesLabel->{"x","y","z"},
        PlotLabel->"z=2",
        ImageSize->250];
Grid[{{p1,p2,p3}},Frame->All]
{b,a} = CoefficientArrays[{eq1,eq2,eq3},
         {x,y,z}];
sol   = LinearSolve[a,-b]//N
Out[301]= {0.5,1.,2.}
Show[p1,p2,p3,
  Graphics3D[{PointSize[0.2],
       Red,Point[sol]}],
  PlotLabel->"point where surfaces meet)"]

Matlab
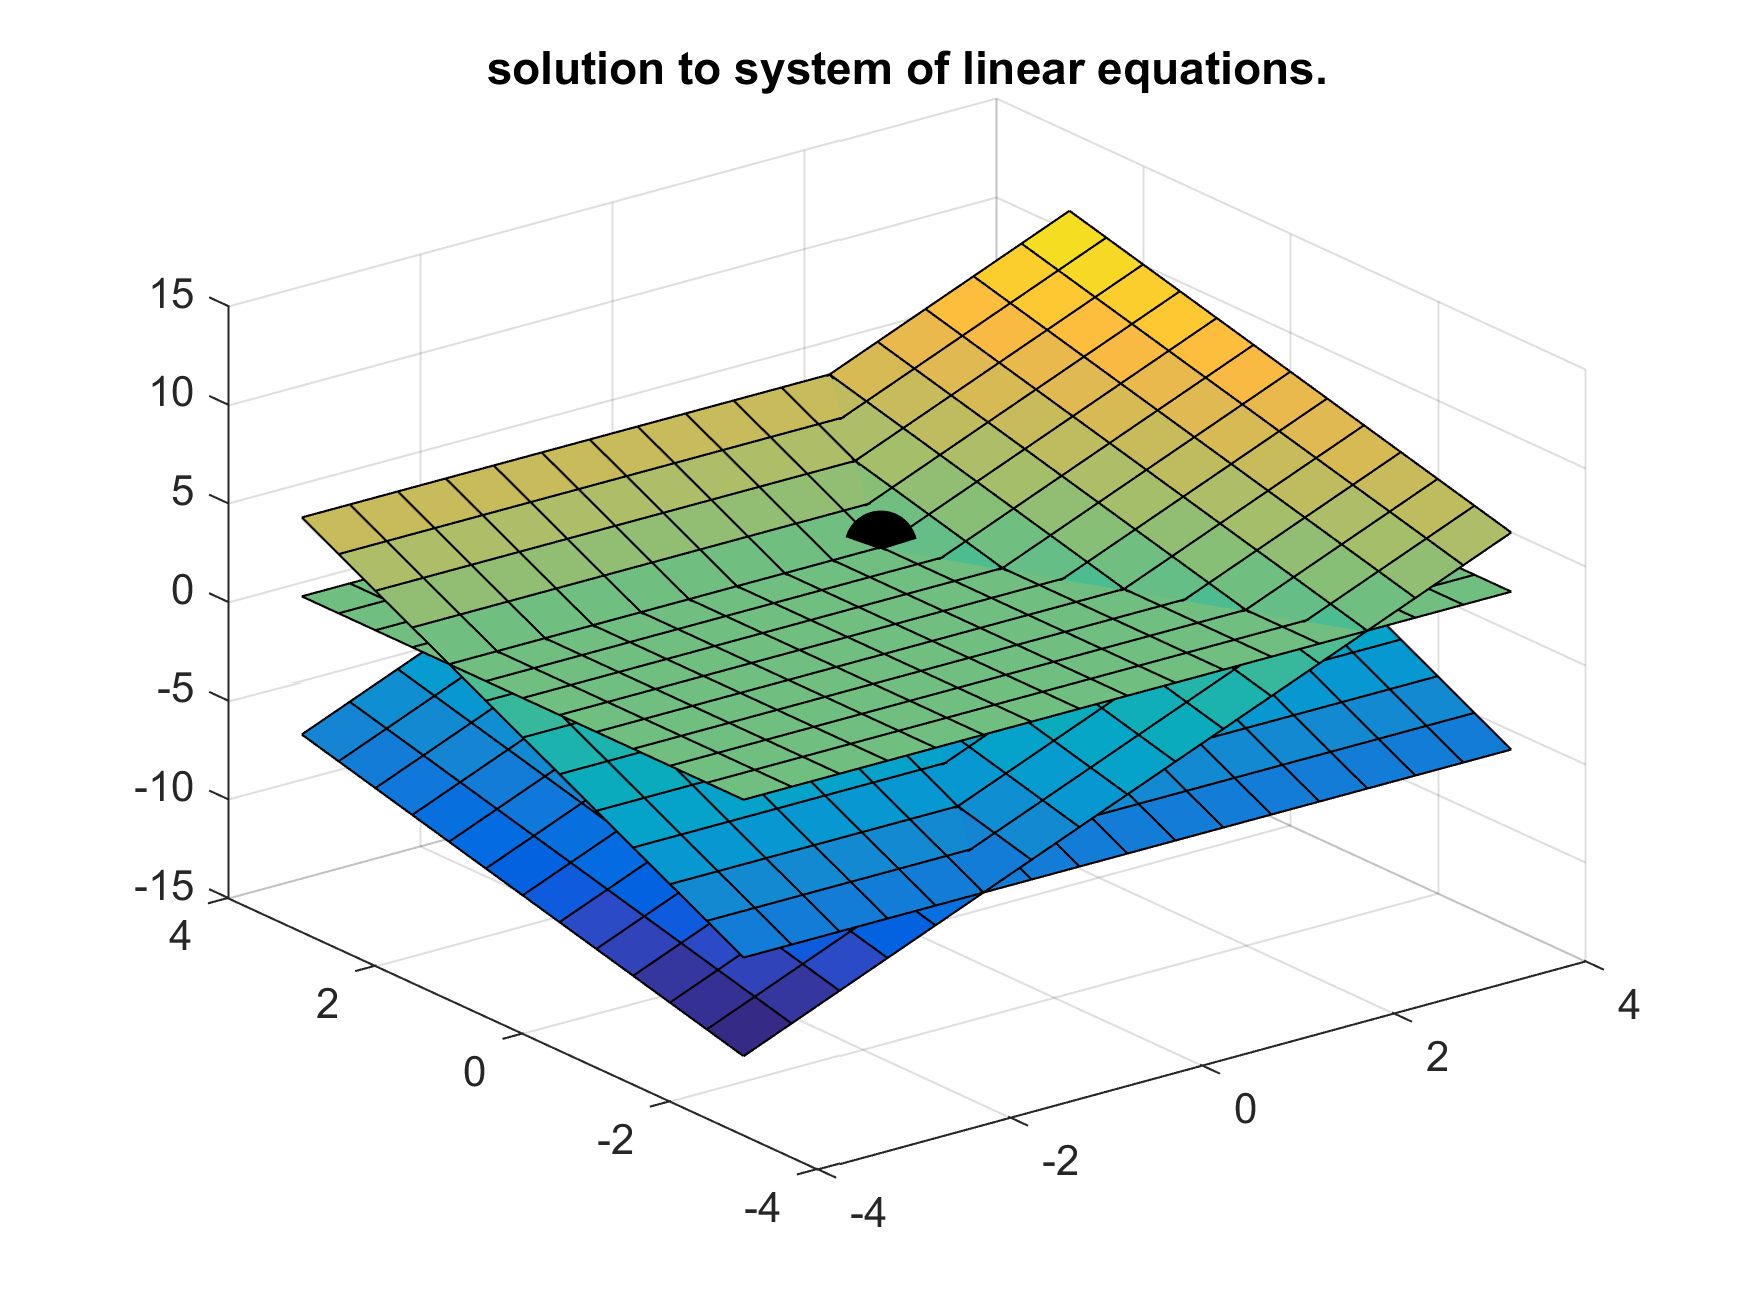
clear all; close all;
x = -4:.5:4;
y = -3:.5:3;

[X,Y] = meshgrid(x,y);

subplot(1,3,1);

Z = 2*X + Y;  surf(X,Y,Z);
title('z=2x+y');

subplot(1,3,2);
Z = 2*Y;  surf(X,Y,Z);
title('z=2y');

subplot(1,3,3);
Z = zeros(length(y),length(x));
Z(1:end,1:end)=2;
surf(X,Y,Z);
title('z=2');

A=[-2 -1 1;0 -2 1;0 0 1];
b=[0;0;2];
sol=A\b

figure;
surf(X,Y,2*X + Y); hold on;
surf(X,Y,2*Y);
surf(X,Y,Z);

%now add the point of intersection
%from the solution

plot3(sol(1),sol(2),sol(3),...
      'k.','MarkerSize',30)

title('solution to system of linear equations.');
sol =

    0.5000
    1.0000
    2.0000