Discussion notes, MAE 185. Friday May 12,2006
Nasser Abbasi
We need to use Netwon's method for root finding. We need to count how many steps it takes to get close enough to a root depending from where we started the search. We need to do this in 2D instead of 1D.
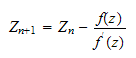
The recursive step is
Where
 is the new 2D point (the point getting closer to the root, we hope) and
 is the previous 2D point.
When to stop this iterative process?
We said in the discussion to stop when

However, this is not really the correct approach. Instead we need to check that we have converged when
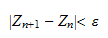
Then we will stop.
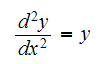
Since this assignment involves using complex numbers with Fortran, and some of you might not have done this before, I will show an example implementation and how to generate different plots from the result, using both Matlab and Mathematica. I will use the first function in the problem set as an illustration. The function is
I used GNU fortran 95 compiler (g95). The program prints the output to stdout,
so you need to pipe the output to a text file that will contain the data
itself. Use the following commands:

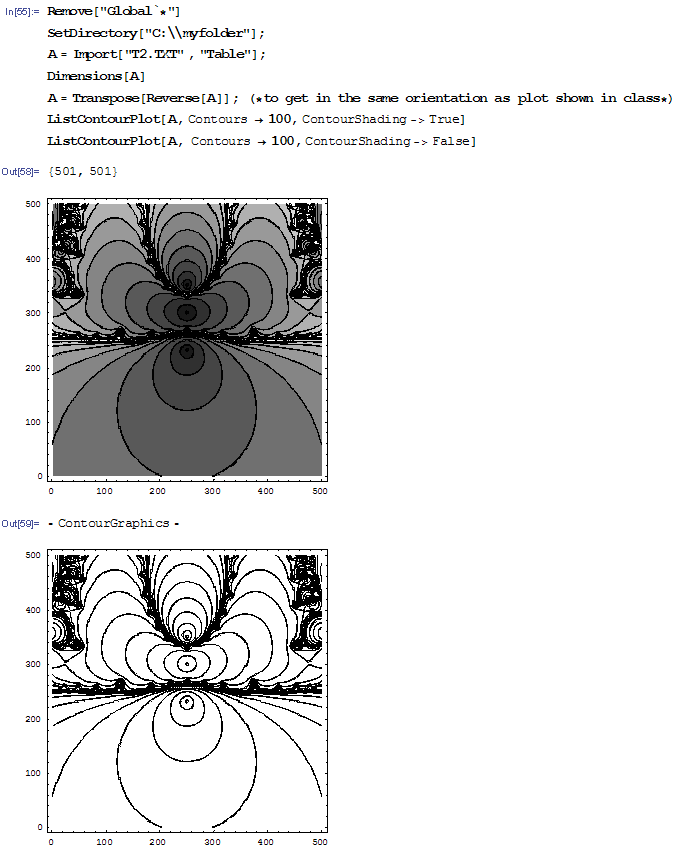
Assume that your text file called "T2.TXT" is located in a folder called
"C:\myfolder\". Now start Mathematica and issue the following commands: (These
plots where generated using an
 ,
and
,
and
 where
where
 is the distance between one point and the next in the grid. See the source
code for more details).
is the distance between one point and the next in the grid. See the source
code for more details).
Start matlab and issue these commands (the plots can be rotated if needed so they align with the ones shown in the classroom).
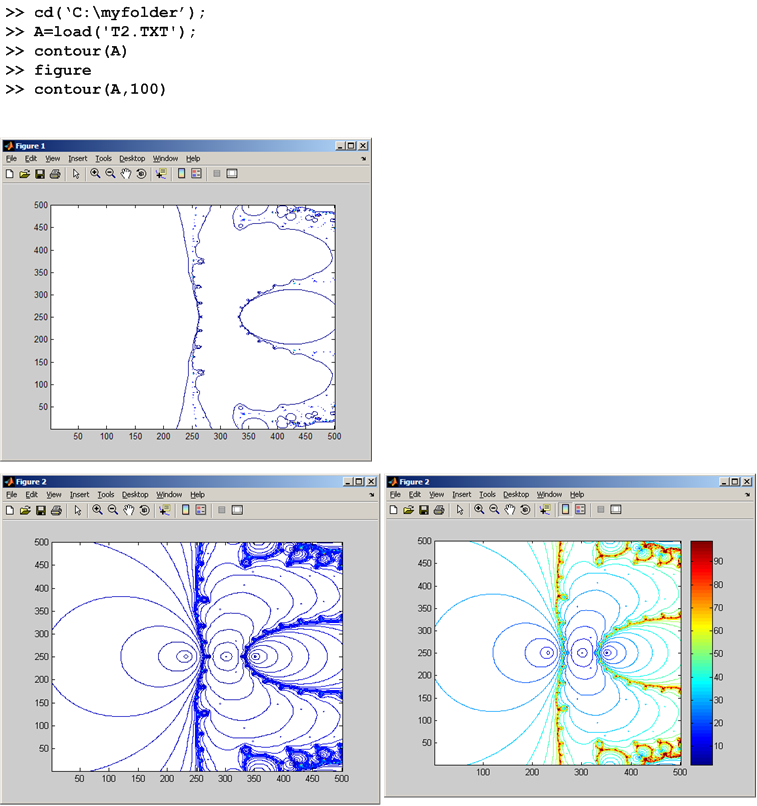
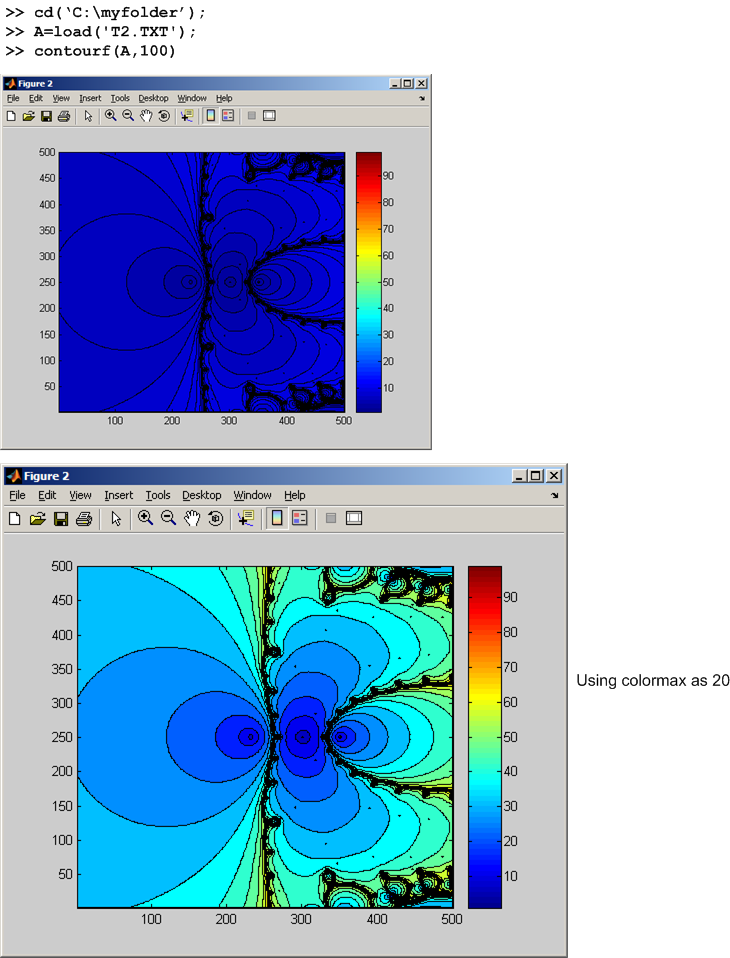
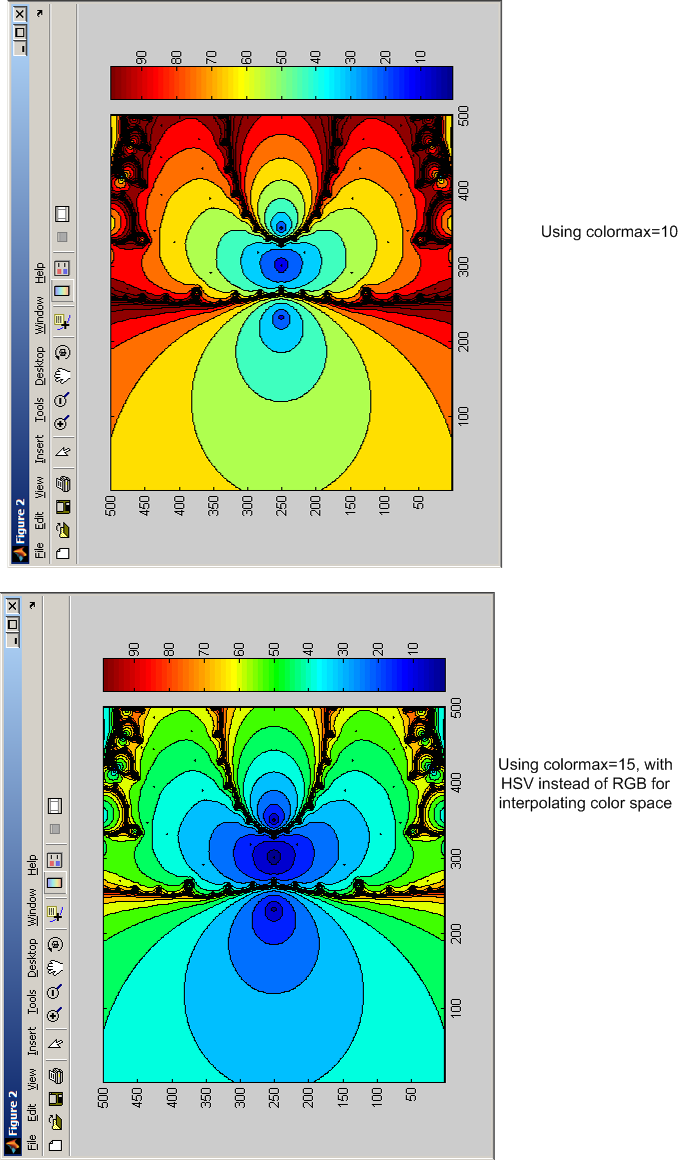
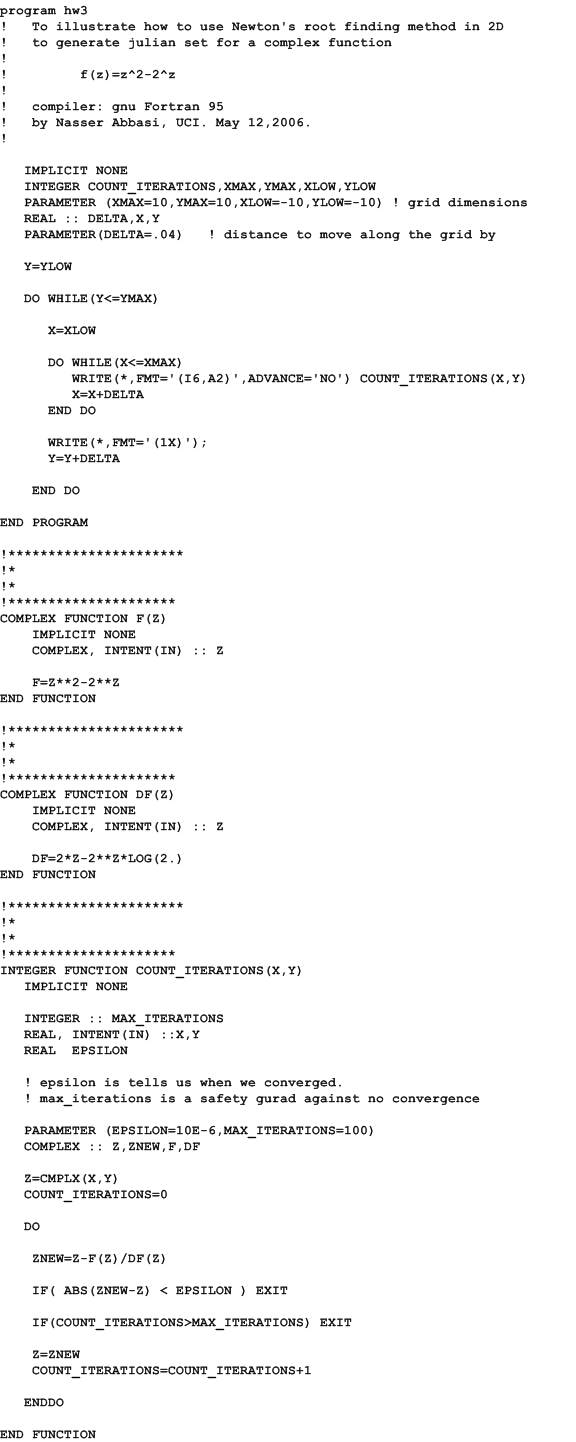
In Matlab you can use the contourf command (not the contour command) to fill the spaces between the contour lines with color shading, then one can use the options on the Matlab figure window itself to make more adjustments to the colors as needed. These are some results shown below. (I rotated some of these plots by hand to make them align to the same direction as the samples shown in the class, but this is not important to do).
To convert an
 order ODE to
 first order ODE's
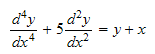
Since we have a second order ODE, we need 2 state variables.

Take derivatives w.r.t. the independent variable


Back substitute for all the derivatives of the dependent variable
 ,
noting that
,
noting that


Example 2
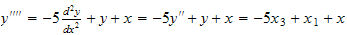
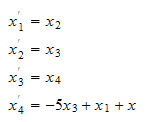
Since a 4th order ODE, need to create 4 new state variables
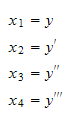
Take derivatives w.r.t. the independent variable

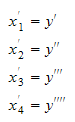
back substitute, noting that