
LAB #3 report. MAE 106. UCI. Winter 2005
Nasser Abbasi, LAB time: Thursday 1/27/2005 6 PM
The motor velocity control system acts as a low pass filter.
The cutoff frequency used was
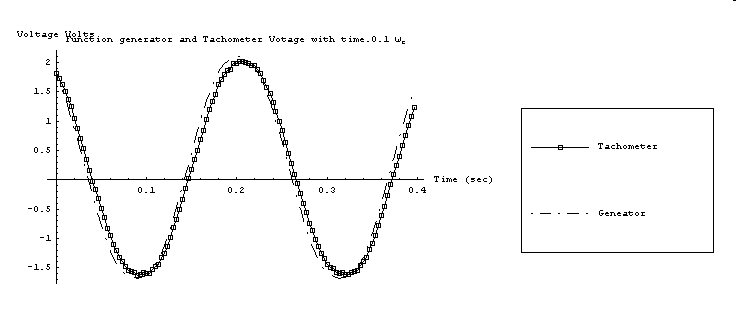
From the 3 data files, I generated 3 plots. One for
 and one for
 and one for

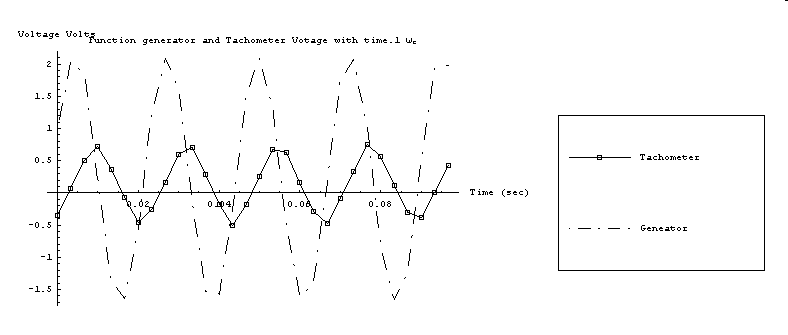
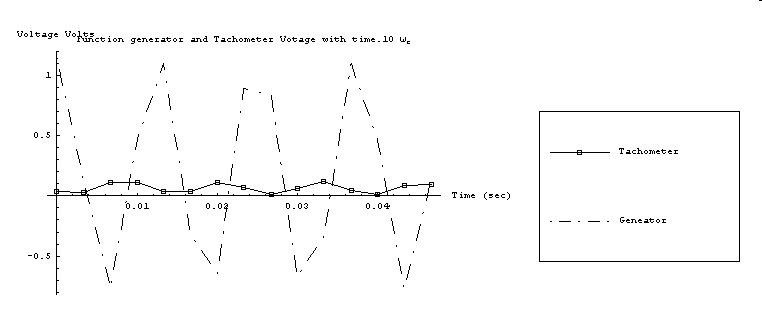
From looking at the 3 plots, I see that the output of the tachmeter shows the amplitude is decreasing as the input (function generator) frequency is increasing. This means the controller acts a a low pass filter.
Below are the 3 plots geneated showing on each the actual and the velocity.
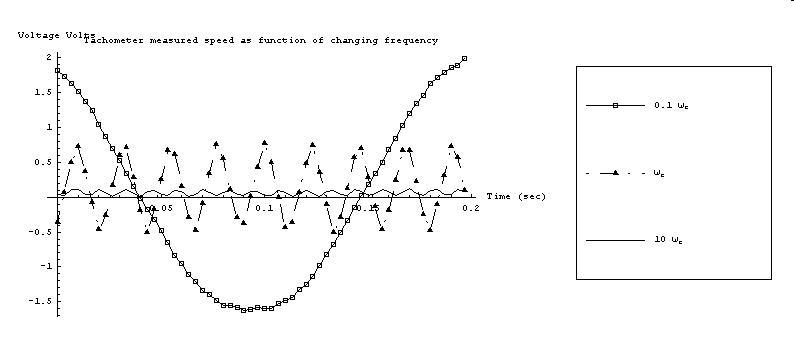
To make more clear, I also plot on the same plot, how the actual velocity changes as the input frequency changes.
This is the result.
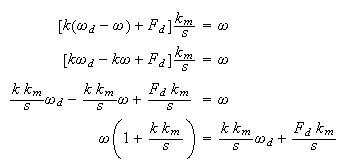
Divide by

for

 ,
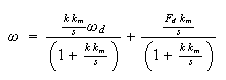
hence we get
,
hence we get
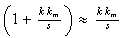
But for
 ,
,

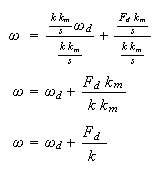
hence

Hence this shows that by using feeback, and by using very large gain
 we can eliminate the effect of the disturbances.