Question on log scalling for plotting the spectrum of an image.
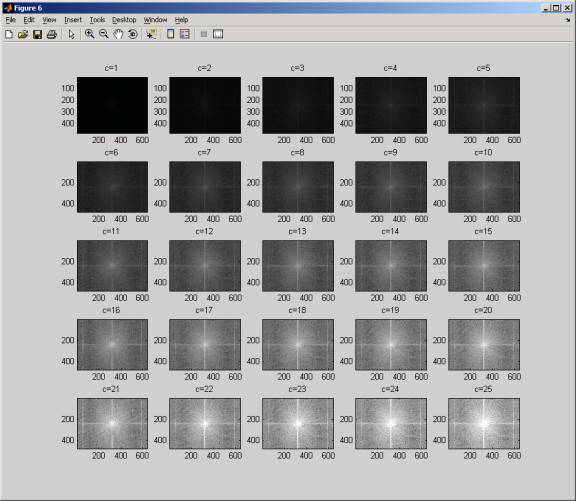
When we plot the 2D Fourier transform magnitude, we need to scale the pixel values using log transform to expand the range of the dark pixels into the bright region so we can better see the transform. We use a ‘c’ value in the equation
s = c log(1+r)
Is there a better way to determine the best value of c to use ? Currently I keep manualy trying different values of ‘c’ until I can see an image that looks best. For example, below is the frequency transform magnitude for the cat image using different ‘c’ values. And for different images, ‘c’ will turn out to be different (some different images I was testing on needed to scale only to c=2 and some I had to go to c=100 to see the Fourier transform magnitude with any clarity.
Thanks,
Nasser