HW 1. Math 504. Spring 2008. CSUF
by Nasser Abbasi
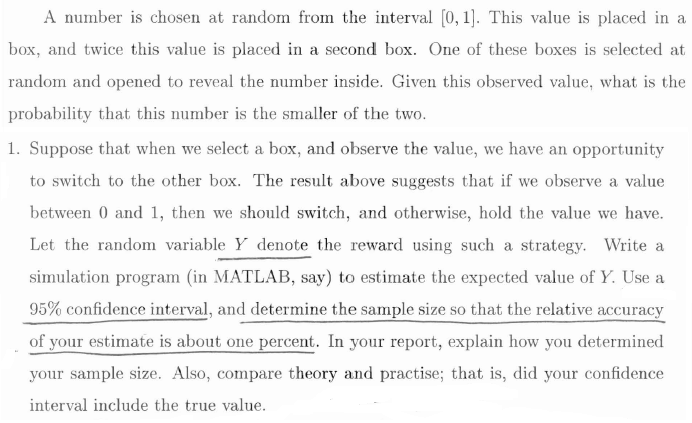
The purpose of this project is to estimate the expected value of a random
variable (called
 )
which is generated by an experiment that is described in the above problem
statement. Each experiment generates one random variable
)
which is generated by an experiment that is described in the above problem
statement. Each experiment generates one random variable
 .
The experiment is described well in the above problem statement and no need to
repeat it here again.
.
The experiment is described well in the above problem statement and no need to
repeat it here again.
In addition, we are asked to determine the interval over which we are 95% confident the estimated expected value will lie within. We are asked that the interval should not be wider than 1% of the true mean from either side of the estimated expected value.
The simulation involve a two stage process. In the first stage, an initial
simulation was made for
 experiments in which we obtained an estimate of the population standard
deviation
experiments in which we obtained an estimate of the population standard
deviation
 and estimate of the population mean given by the sample mean
 .
These 2 values are used to determined the sample size (number of experiments)
needed for the second simulation performed to meet the above stated
requirement for relative accuracy in expected value of
.
These 2 values are used to determined the sample size (number of experiments)
needed for the second simulation performed to meet the above stated
requirement for relative accuracy in expected value of
 .
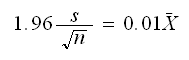
Therefore, once the first simulation is completed, the sample size for the
second simulation was found by solving for
.
Therefore, once the first simulation is completed, the sample size for the
second simulation was found by solving for
 (sample size) by setting the expression for the standard error to be
 of the population mean (in which we are using an estimate of which is
 as generated by the first simulation). Therefore, we solve for
 from
from Finally,
the second simulation was now run using the above computed
Finally,
the second simulation was now run using the above computed
 ,
and the confidence interval was found
from
,
and the confidence interval was found
from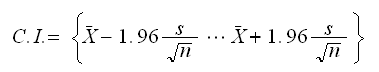 Where
in the above equation the
Where
in the above equation the
 and
and
 are the sample standard deviation and the sample mean resulting from this
second simulation (and not the first simulation run used to estimate
are the sample standard deviation and the sample mean resulting from this
second simulation (and not the first simulation run used to estimate
 ).
).
Next, the histogram
 was plotted to obtain an estimated of the probability density function of
 .
.
For the initial simulation run, we used
 experiments and obtained the following estimate of the standard deviation and
the population
mean
experiments and obtained the following estimate of the standard deviation and
the population
mean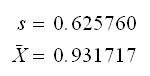
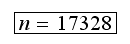
Now solve for
 from
from
 we found
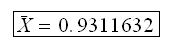
Running the second stage simulation now to estimate the expected value of
 we obtain the following result that the estimate of the expected value of
 is
is
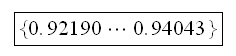
and the
 confidence interval was found to be
Since we know that the true value of
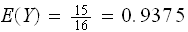 ,
we see that the
,
we see that the
We also notice that the relative error in
 (the estimate of the expected value) when compared to the true mean
 is calculated as
 which is little below the
 requirement.
We note that the value of the relative error did not come out exactly
 because we used an estimate of the true mean in order to find the sample size
needed for the calculation.
because we used an estimate of the true mean in order to find the sample size
needed for the calculation.
The result of the simulation is the estimate of the PDF of
 which is shown in the plot below. The number of bins used is
 .
This was determined by trial and error to obtain the most pleasing looking
histogram.
.
This was determined by trial and error to obtain the most pleasing looking
histogram.
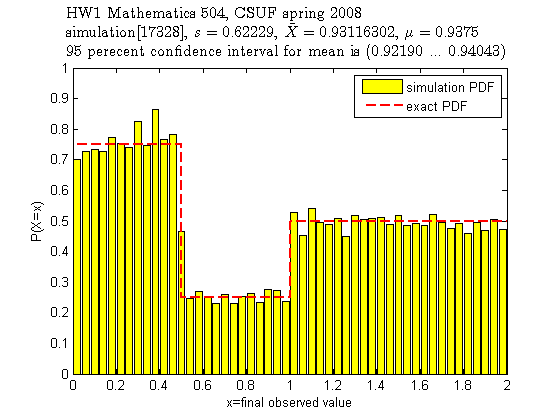
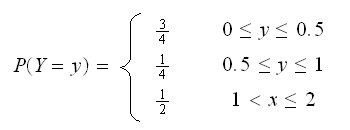
We note that the true PDF is given below (derived in the class) and we see from the above plot that the estimated PDF is very close to the analytical PDF.