Problem 7.12
Nasser Abbasi
Output:
Part (a)
For light traffic, the peak of the density moves forward at a speed of 9.3 meters/second.
The modified program determines the direction of the density wave and the speed. This is an example run for rho_zero = ¼ rho_max (ran it 3 times, once for each method)
RUN 1
»
nma_problem_7_12
traffic - Program to solve the generalized
Burger
equation for the traffic at a stop light
problem
solves problem 7.12
select
numerical method: FTCS=1, Lax=2
Lax-Wendroff=3 :1
You selected method 1
Enter
the number of grid points: (suggest 80):80
Enter
value for L, sytem size in meters. (suggest 400) :400
Suggested
timestep is 0.2
Enter
time step (tau): 0.02
Last
car starts moving after 200 steps
Enter
number of steps: 200
Maximum
density (rho max) suggest 1 :1
Enter
value for alpha (suggested 1/5):1/5
Enter
value for sigma as ratio of L (suggest 1/8):1/8
Now
we value for rho_zero as ratio of max density
Try
1/4 for light traffic, 3/4 for heavy traffic, and 1/2 for part c
Enter
value for rho_zero as ratio of max density (suggest 1/4):1/4
density
wave peak starting in the left half
speed
of wave is positive
distance
travelled = 37.500000 meters
Duration
of simulation = 4.000000 seconds
Number
of time wave crossed from one half to the other half=1
speed
= 9.375000
»
RUN 2 (notice countour matlab problem?)
»
nma_problem_7_12
traffic - Program to solve the generalized
Burger
equation for the traffic at a stop light
problem
solves problem 7.12
select
numerical method: FTCS=1, Lax=2
Lax-Wendroff=3 :2
You selected method 2
Enter
the number of grid points: (suggest 80):80
Enter
value for L, sytem size in meters. (suggest 400) :400
Suggested
timestep is 0.2
Enter
time step (tau): 0.02
Last
car starts moving after 200 steps
Enter
number of steps: 200
Maximum
density (rho max) suggest 1 :1
Enter
value for alpha (suggested 1/5):1/5
Enter
value for sigma as ratio of L (suggest 1/8):1/8
Now
we value for rho_zero as ratio of max density
Try
1/4 for light traffic, 3/4 for heavy traffic, and 1/2 for part c
Enter
value for rho_zero as ratio of max density (suggest 1/4):1/4
density
wave peak starting in the left half
speed
of wave is positive
distance
travelled = 47.500000 meters
Duration
of simulation = 4.000000 seconds
Number
of time wave crossed from one half to the other half=1
speed
= 11.875000
Warning:
Reference to uninitialized variable levels in clabel/plus_labels at line 473.
>
In C:\MATLABR11\toolbox\matlab\specgraph\clabel.m (plus_labels) at line 473
In C:\MATLABR11\toolbox\matlab\specgraph\clabel.m
at line 65
In
D:\nabbasi\data\nabbasi_web_page\academic\my_courses\phys_240\HW19\nma_problem_7_12.m
at line 221
Warning:
Reference to uninitialized variable levels in clabel/plus_labels at line 474.
>
In C:\MATLABR11\toolbox\matlab\specgraph\clabel.m (plus_labels) at line 474
In
C:\MATLABR11\toolbox\matlab\specgraph\clabel.m at line 65
In
D:\nabbasi\data\nabbasi_web_page\academic\my_courses\phys_240\HW19\nma_problem_7_12.m
at line 221
Warning:
Reference to uninitialized variable levels in clabel/plus_labels at line 475.
>
In C:\MATLABR11\toolbox\matlab\specgraph\clabel.m (plus_labels) at line 475
In
C:\MATLABR11\toolbox\matlab\specgraph\clabel.m at line 65
In
D:\nabbasi\data\nabbasi_web_page\academic\my_courses\phys_240\HW19\nma_problem_7_12.m
at line 221
Warning:
Reference to uninitialized variable levels in clabel/plus_labels at line 476.
>
In C:\MATLABR11\toolbox\matlab\specgraph\clabel.m (plus_labels) at line 476
In C:\MATLABR11\toolbox\matlab\specgraph\clabel.m
at line 65
In
D:\nabbasi\data\nabbasi_web_page\academic\my_courses\phys_240\HW19\nma_problem_7_12.m
at line 221
»
RUN 3
»
nma_problem_7_12
traffic - Program to solve the generalized
Burger
equation for the traffic at a stop light
problem
solves problem 7.12
select
numerical method: FTCS=1, Lax=2
Lax-Wendroff=3 :3
You selected method 3
Enter
the number of grid points: (suggest 80):80
Enter
value for L, sytem size in meters. (suggest 400) :400
Suggested
timestep is 0.2
Enter
time step (tau): 0.02
Last
car starts moving after 200 steps
Enter
number of steps: 200
Maximum
density (rho max) suggest 1 :1
Enter
value for alpha (suggested 1/5):1/5
Enter
value for sigma as ratio of L (suggest 1/8):1/8
Now
we value for rho_zero as ratio of max density
Try
1/4 for light traffic, 3/4 for heavy traffic, and 1/2 for part c
Enter
value for rho_zero as ratio of max density (suggest 1/4):1/4
density
wave peak starting in the left half
speed
of wave is positive
distance
travelled = 37.500000 meters
Duration
of simulation = 4.000000 seconds
Number
of time wave crossed from one half to the other half=1
speed
= 9.375000
Warning:
Reference to uninitialized variable levels in clabel/plus_labels at line 473.
>
In C:\MATLABR11\toolbox\matlab\specgraph\clabel.m (plus_labels) at line 473
In
C:\MATLABR11\toolbox\matlab\specgraph\clabel.m at line 65
In
D:\nabbasi\data\nabbasi_web_page\academic\my_courses\phys_240\HW19\nma_problem_7_12.m
at line 221
Warning:
Reference to uninitialized variable levels in clabel/plus_labels at line 474.
>
In C:\MATLABR11\toolbox\matlab\specgraph\clabel.m (plus_labels) at line 474
In
C:\MATLABR11\toolbox\matlab\specgraph\clabel.m at line 65
In
D:\nabbasi\data\nabbasi_web_page\academic\my_courses\phys_240\HW19\nma_problem_7_12.m
at line 221
Warning:
Reference to uninitialized variable levels in clabel/plus_labels at line 475.
>
In C:\MATLABR11\toolbox\matlab\specgraph\clabel.m (plus_labels) at line 475
In
C:\MATLABR11\toolbox\matlab\specgraph\clabel.m at line 65
In D:\nabbasi\data\nabbasi_web_page\academic\my_courses\phys_240\HW19\nma_problem_7_12.m
at line 221
Warning:
Reference to uninitialized variable levels in clabel/plus_labels at line 476.
>
In C:\MATLABR11\toolbox\matlab\specgraph\clabel.m (plus_labels) at line 476
In
C:\MATLABR11\toolbox\matlab\specgraph\clabel.m at line 65
In
D:\nabbasi\data\nabbasi_web_page\academic\my_courses\phys_240\HW19\nma_problem_7_12.m
at line 221
»

Part b
Now repeat the above for HEAVY traffic
Run it 3 times, once per different method. The peak of the density now moves backward. This can be interpreted as this: As cars start to move forward, the point where the peak of the density starts to move backwards since the cars in the back are still standing still while the cars in the front are starting to move. this continues until the last car start to move forward.
RUN 1
»
nma_problem_7_12
traffic - Program to solve the generalized
Burger
equation for the traffic at a stop light
problem
solves problem 7.12
select
numerical method: FTCS=1, Lax=2
Lax-Wendroff=3 :1
You selected method 1
Enter
the number of grid points: (suggest 80):80
Enter
value for L, sytem size in meters. (suggest 400) :400
Suggested
timestep is 0.2
Enter
time step (tau): 0.02
Last
car starts moving after 200 steps
Enter
number of steps: 200
Maximum
density (rho max) suggest 1 :1
Enter
value for alpha (suggested 1/5):1/5
Enter
value for sigma as ratio of L (suggest 1/8):1/8
Now
we value for rho_zero as ratio of max density
Try
1/4 for light traffic, 3/4 for heavy traffic, and 1/2 for part c
Enter
value for rho_zero as ratio of max density (suggest 1/4):3/4
density
wave peak starting in the left half
speed
of wave is negative
distance
travelled = 80.000000 meters
Duration
of simulation = 4.000000 seconds
Number
of time wave crossed from one half to the other half=0
speed
= 20.000000
»
RUN 2
»
nma_problem_7_12
traffic - Program to solve the generalized
Burger
equation for the traffic at a stop light
problem
solves problem 7.12
select
numerical method: FTCS=1, Lax=2
Lax-Wendroff=3 :2
You selected method 2
Enter
the number of grid points: (suggest 80):80
Enter
value for L, sytem size in meters. (suggest 400) :400
Suggested
timestep is 0.2
Enter
time step (tau): 0.02
Last
car starts moving after 200 steps
Enter
number of steps: 200
Maximum
density (rho max) suggest 1 :1
Enter
value for alpha (suggested 1/5):1/5
Enter
value for sigma as ratio of L (suggest 1/8):1/8
Now
we value for rho_zero as ratio of max density
Try
1/4 for light traffic, 3/4 for heavy traffic, and 1/2 for part c
Enter
value for rho_zero as ratio of max density (suggest 1/4):3/4
density
wave peak starting in the left half
speed
of wave is negative
distance
travelled = 60.000000 meters
Duration
of simulation = 4.000000 seconds
Number
of time wave crossed from one half to the other half=0
speed
= 15.000000
»
RUN 3
»
nma_problem_7_12
traffic - Program to solve the generalized
Burger
equation for the traffic at a stop light
problem
solves problem 7.12
select
numerical method: FTCS=1, Lax=2
Lax-Wendroff=3 :3
You selected method 3
Enter
the number of grid points: (suggest 80):80
Enter
value for L, sytem size in meters. (suggest 400) :400
Suggested
timestep is 0.2
Enter
time step (tau): 0.02
Last
car starts moving after 200 steps
Enter
number of steps: 200
Maximum
density (rho max) suggest 1 :1
Enter
value for alpha (suggested 1/5):1/5
Enter
value for sigma as ratio of L (suggest 1/8):1/8
Now
we value for rho_zero as ratio of max density
Try
1/4 for light traffic, 3/4 for heavy traffic, and 1/2 for part c
Enter
value for rho_zero as ratio of max density (suggest 1/4):3/4
density
wave peak starting in the left half
speed
of wave is negative
distance
travelled = 75.000000 meters
Duration
of simulation = 4.000000 seconds
Number
of time wave crossed from one half to the other half=0
speed
= 18.750000
»
part C
Run the program for Lax-Wendroff, using rho_zero = ½ rho_max.
This show the wave moved very little compared with all the other runs. Speed was only 3m/sec.
»
nma_problem_7_12
traffic - Program to solve the generalized
Burger
equation for the traffic at a stop light
problem
solves problem 7.12
select
numerical method: FTCS=1, Lax=2
Lax-Wendroff=3 :3
You selected method 3
Enter
the number of grid points: (suggest 80):80
Enter
value for L, sytem size in meters. (suggest 400) :400
Suggested
timestep is 0.2
Enter
time step (tau): 0.02
Last
car starts moving after 200 steps
Enter
number of steps: 200
Maximum
density (rho max) suggest 1 :1
Enter
value for alpha (suggested 1/5):1/5
Enter
value for sigma as ratio of L (suggest 1/8):1/8
Now
we value for rho_zero as ratio of max density
Try
1/4 for light traffic, 3/4 for heavy traffic, and 1/2 for part c
Enter
value for rho_zero as ratio of max density (suggest 1/4):1/2
density
wave peak starting in the left half
speed of wave is negative
distance
travelled = 15.000000 meters
Duration
of simulation = 4.000000 seconds
Number
of time wave crossed from one half to the other half=0
speed
= 3.750000
»
SOURCE CODE
%
traffic - Program to solve the generalized Burger
%
equation for the traffic at a stop light problem
% solves
problem 7.12
% Nasser
Abbasi
clear all; help nma_problem_7_12; % Clear memory and print header
%*
Select numerical parameters (time step, grid spacing, etc.).
try_again=1;
while(try_again)
method = input('select numerical
method: FTCS=1, Lax=2 Lax-Wendroff=3 :');
if( method<1 | method>3 )
fprintf('Please try again,
choice must be 1 or 2 or 3.\n');
else
try_again=0;
fprintf('You selected method
%d\n',method);
end
end
N = input('Enter the number of grid points: (suggest 80):');
L = input('Enter value for L, sytem size in meters. (suggest 400)
:'); %was 400 System size (meters)
h = L/N; % Grid
spacing for periodic boundary conditions
v_max = 25; % Maximum
car speed (m/s)
fprintf('Suggested timestep is %g\n',h/v_max);
tau = input('Enter time step (tau): ');
fprintf('Last car starts moving after %g steps\n', ...
(L/4)/(v_max*tau));
nstep = input('Enter number of steps: ');
coeff = tau/(2*h); %
Coefficient used by all schemes
coefflw =
tau^2/(2*h^2); %
Coefficient used by Lax-Wendroff
%* Set
initial and boundary conditions
rho_max = input('Maximum density (rho max) suggest 1 :'); % was 1.0 Maximum density
Flow_max =
0.25*rho_max*v_max; % Maximum Flow
%
% input
parameters for new initial conditions
%
alpha = input('Enter value for alpha (suggested 1/5):');
sigma = input('Enter value for sigma as ratio of L (suggest 1/8):');
sigma = sigma * L;
fprintf('\nNow we value for rho_zero as ratio of max density\n');
fprintf('Try 1/4 for light traffic, 3/4 for heavy traffic, and
1/2 for part c\n\n');
rho_zero = input('Enter value for rho_zero as ratio of max density
(suggest 1/4):');
rho_zero = rho_zero *
rho_max;
%
Initial condition is a square pulse from x = -L/4 to x = 0
%rho =
zeros(1,N);
%for
i=round(N/4):round(N/2-1)
% rho(i) = rho_max; % Max density in the square pulse
%end
%rho(round(N/2))
= rho_max/2; % Try running without this
line
% Use
periodic boundary conditions
ip(1:N) = (1:N)+1; ip(N) = 1;
% ip = i+1 with periodic b.c.
im(1:N) = (1:N)-1; im(1) = N;
% im = i-1 with periodic b.c.
%*
Initialize plotting variables.
iplot = 1;
xplot = ((1:N)-1/2)*h -
L/2; %
Record x scale for plot
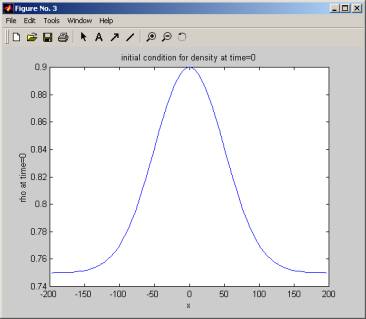
%
% Now
find initial condition for density
%
rho = zeros(1,N);
for(i=1:length(xplot))
rho(i) = rho_zero * ( 1 + alpha * exp(- xplot(i)^2 / (2 *
sigma^2)));
end
figure;
plot(xplot,rho);
title('initial condition for density at time=0');
xlabel('x');
ylabel('rho at time=0');
rplot(:,1) = rho(:); %
Record the initial state
tplot(1) = 0;
figure;
%
% To
find the speed of the wave, record the distance travelled by
% the
peak of the density. when the simulation is over, we know the
% time
it took and hence we find the speed
%
[peak,index]= max(rho);
initialX=
xplot(index); %
this is where peak density is at start.
if(
initialX <= 0 )
fprintf('density wave peak
starting in the left half\n');
else
fprintf('density Wave peak
starting in the right half\n');
end
signInitialX = initialX;
numberOfFlips = 0;
checkedForDirection = 0; % flag to tell me to find wave direction
direction = 1; % will be
set correctly in the loop below.
%* Loop
over desired number of steps.
for istep=1:nstep
%* Compute the flow =
(Density)*(Velocity)
Flow = rho .* (v_max*(1 -
rho/rho_max));
%* Compute new values of density
using FTCS,
%
Lax or Lax-Wendroff method.
if(
method == 1 ) %%% FTCS method %%%
rho(1:N) = rho(1:N) -
coeff*(Flow(ip)-Flow(im));
elseif( method == 2 ) %%% Lax
method %%%
rho(1:N) =
.5*(rho(ip)+rho(im)) ...
-
coeff*(Flow(ip)-Flow(im));
else %%% Lax-Wendroff method %%%
cp = v_max*(1 -
(rho(ip)+rho(1:N))/rho_max);
cm = v_max*(1 - (rho(1:N)+rho(im))/rho_max);
rho(1:N) = rho(1:N) - coeff*(Flow(ip)-Flow(im)) ...
+
coefflw*(cp.*(Flow(ip)-Flow(1:N)) ...
-
cm.*(Flow(1:N)-Flow(im)));
end
%* Record density for plotting.
iplot = iplot+1;
rplot(:,iplot) = rho(:);
tplot(iplot) = tau*istep;
%* Display snap-shot of density
versus position
plot(xplot,rho,'-',xplot,Flow/Flow_max,'--');
xlabel('x'); ylabel('Density and Flow');
legend('\rho(x,t)','F(x,t)');
axis([-L/2, L/2, -0.1, 1.1]);
drawnow;
%
% for speed calculation
%
% first find it wave is running
clockwise or anti clock wise
% need to check after one istep
to find that out
[peak,index]= max(rho);
currentX= xplot(index); % this is
where peak density is at now
if( checkedForDirection==0)
checkedForDirection = 1;
if( currentX > initialX )
direction = 1; % 1 means anti clock wise
fprintf('speed of wave is positive\n');
else
direction = 0;
fprintf('speed of wave is
negative\n');
end
end
% now record how many time the
wave flips around the track
if( (signInitialX * currentX)
< 0 )
numberOfFlips = numberOfFlips + 1;
signInitialX= - signInitialX;
end
end
if(
initialX <= 0 ) % wave peak started on the
left side.
if(direction == 1 ) % anticlock
wise
if(currentX >= 0 )
lastPart = currentX + (numberOfFlips-1)*L/2;
else
lastPart = L/2 - abs(currentX) + abs(initialX);
lastPart = lastPArt + (numberOfFlips-1)*L/2;
end
else
if( currentX >= 0 )
lastPart = L/2 - currentX + L/2 - abs(initialX);
lastPart =
lastPart + (numberOfFlips-1)*L/2;
else
if( abs(currentX) >
abs(initialX))
if(numberOfFlips > 0
)
lastPart = abs(currentX) + L/2 -abs(initialX) +
(numberOfFlips-1)*L/2;
else
lastPart =
abs(currentX) -abs(initialX);
end
else
lastPart = abs(currentX) + L/2 - abs(initialX) +
(numberOfFlips-1)*L/2;
end
end
end
else %
initialX on the right half
if( direction == 1 )
if(currentX >= 0 )
lastPart = currentX + (numberOfFlips-1)*L/2
else
lastPart = L/2-InitialX+ L/2- abs(currentX) +
(numberOfFlips-1)*L/2;
end
else
if(currentX > 0 )
lastPart = L/2 - currentX + L/2 - initialX +
(numberOfFlips-1)*L/2;
else
lastPart = initialX + abs(currentX) +
(numberOfFlips-1)*L/2;
end
end
end
speed = lastPart /
(istep*tau);
fprintf('distance travelled = %f meters\n',lastPart);
fprintf('Duration of simulation = %f seconds \n',istep*tau);
fprintf('Number of time wave crossed from one half to the other
half=%d\n',numberOfFlips);
fprintf('speed = %f\n',speed);
%* Graph
density versus position and time as wire-mesh plot
figure; % Clear
figure 1 window and bring forward
mesh(tplot,xplot,rplot)
xlabel('t'); ylabel('x');
zlabel('\rho');
title('Density versus position and time');
view([100 30]); % Rotate the
plot for better view point
pause(1); % Pause 1
second between plots
%* Graph
contours of density versus position and time.
figure; % Clear
figure 2 window and bring forward
% Use
rot90 function to graph t vs x since
%
contour(rplot) graphs x vs t.
clevels = 0:(0.1):1; % Contour
levels
cs =
contour(xplot,tplot,flipud(rot90(rplot)),clevels);
clabel(cs); %
Put labels on contour levels
xlabel('x');
ylabel('time'); title('Density
contours');