Problem 5.12
OUTPUT
» nma_HW_5_12
program to solve problem 5.12
Nasser Abbasi
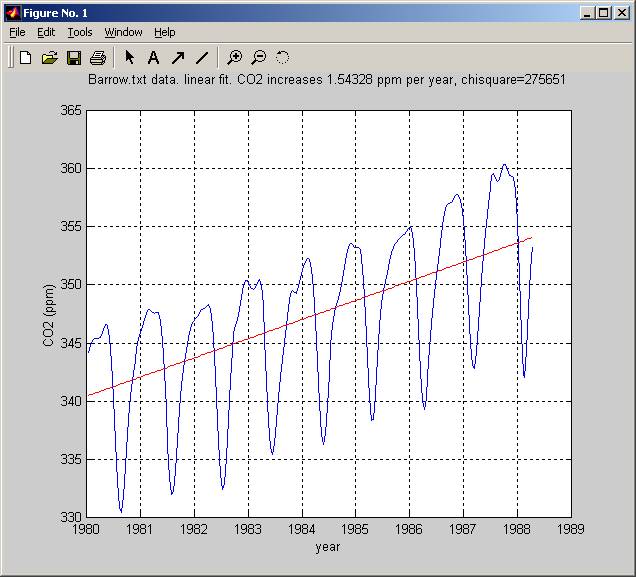
Enter the file name that contains the data:'Barrow.txt'
Enter constant sigma (error of data measurment) [ppm] :0.16
read 230 data points
in the year 2005 CO2 will be 10 percent over the 1980 level
» 
» nma_HW_5_12
program to solve problem 5.12
Nasser Abbasi
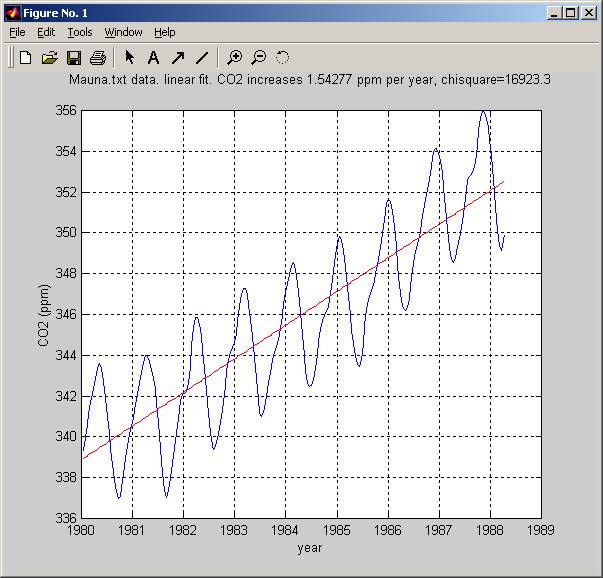
Enter the file name that contains the data:'Mauna.txt'
Enter constant sigma (error of data measurment) [ppm] :0.27
read 230 data points
in the year 2003 CO2 will be 10 percent over the 1980 level
» 
source code
function nma_HW_5_12()
%
%
program to solve problem 5.12
% Nasser
Abbasi
%
clear all; help
nma_HW_5_12;
fileName = input('Enter the file name that contains the data:');
sigma = input('Enter
constant sigma (error of data measurment) [ppm] :');
[fid,errMsg] =
fopen(fileName,'rt');
if(fid
== -1)
fprintf('Failed to open file, error
is %s\n',errMsg);
return;
end
[temp,count] = fscanf(fid,'%s',1);
i=0;
while(count
== 1)
i=i+1;
y(i)= str2double(temp);
if( isnan(y(i) ))
fprintf('Failed to convert y
value ''%s'' at line %d\n',temp,i);
return;
end
[temp,count] = fscanf(fid,'%s',1);
end
if(i==0)
fprintf('No data read!, empty file');
return;
end
fprintf('read %d data points\n',i);
fclose(fid);
plot(y);
%
% since
using linear regression, need to calculate
%
Y=a1+a2 x. Need to find a1, and a2. use equation
% 5.11
%
% use
the function provided by professor called
% linreg
to calculate a1,a2,yy,chisqr and parameter
%
errors.
%
%
% sigma
is contant for each data point, so spread it over
% each
point before calling linreg
%
sigma(1:length(y))=sigma;
[a_fit,sig_a,yy,chisqr] =
linreg([1:length(y)],y,sigma);
%
% to
find rate of increase per year, use the slope a2 from
% above.
But note that this slope is per data point, which
%
happened each 2 weeks. There are 52 weeks per year, so
% to
find rate per year, mutiply this number by 26.
%
hold on;
plot(yy,'-r');
xlabel('year');
ylabel('CO2 (ppm)');
% make
the x-ticks go from 1980:1989 finally I
know how to do this.
newXlabel=[1980:1989];
l=get(gca,'xtick');
l=linspace(l(1),l(end),length(newXlabel));
set(gca,'xtick',l);
set(gca,'xticklabel',newXlabel);
title(sprintf('%s data. linear fit. CO2 increases %g ppm per year,
chisquare=%g\n',...
fileName,a_fit(2)*26, chisqr));
grid on;
%
% find
when co2 will be 10% over 1980 level, use the Y=a1+a2(x) to
% tell
use this.
%
newY = y(1)+y(1)*0.1; % this is
the y value
x = (newY - a_fit(1)) / a_fit(2) ; % calculate
x from the linear regression
fprintf('in the year %d CO2 will be 10 percent over the 1980
level\n',...
ceil(1980+(x/26)));