Homework 1 for Physics 240
By Nasser Abbasi
Problem 3(a,b), chapter 1
Problem: Reproduce the plots in figure 1.1. Try to be as accurate as possible in your reconstruction [matlab].
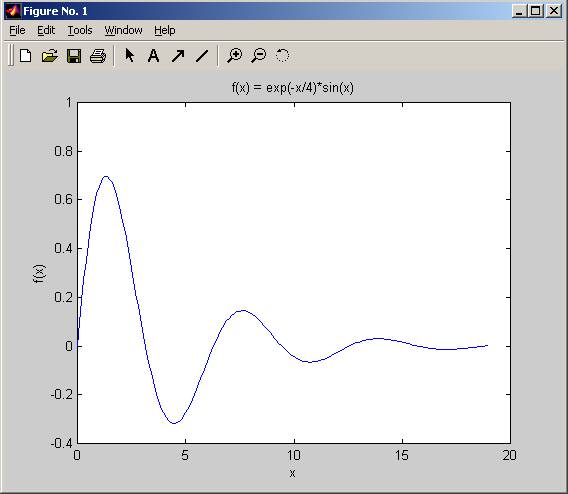
1.3(a)
» clear all
» x=0:0.1:19;
» y=exp(-x/4) .* sin(x);
» plot(x,y)
» set(gca,'xtick',[0 5 10 15 20]);
» xlabel('x');
» ylabel('f(x)');
» title('f(x) = exp(-x/4)*sin(x)');
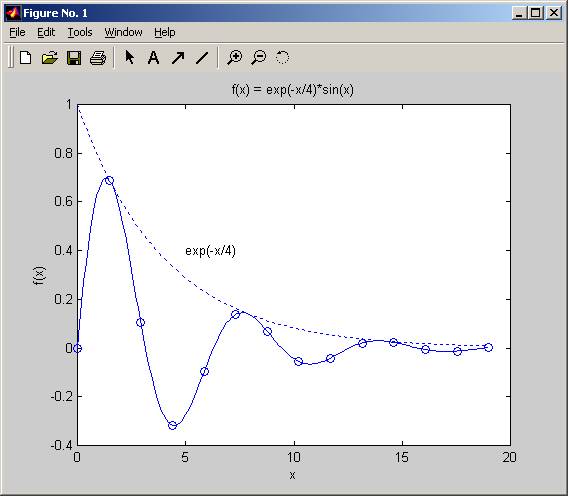
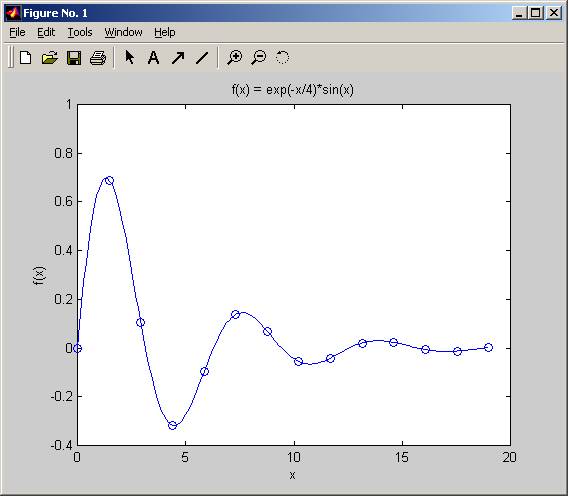
1.3(b)
» clear all
» x=0:0.1:19;
» y=exp(-x/4) .* sin(x);
» plot(x,y)
» hold on
» set(gca,'xtick',[0 5 10 15 20]);
» xlabel('x');
» ylabel('f(x)');
» title('f(x) = exp(-x/4)*sin(x)');
» % Now plot the 'o' points, counting, I see 13 of them.
» x1=0:19/13:19;
» y1=exp(-x1/4) .* sin(x1);
» plot(x1,y1,'o')
» % Now add the exp(-x/4) curve
» plot(x,exp(-x/4),':')
» text (5,0.4,'exp(-x/4)')