 is the sampling frequency
 is the passband end frequency
 is the start of stopband frequency
 is the attenuation in db at
 is the attenuation in db at
 , which is then mapped to the digital filter transfer function
  . The
transformation of
. The
transformation of  to
to  can be made using a bilinear transformation or impulse
invariance.
can be made using a bilinear transformation or impulse
invariance.
Carry out the design by inputting the filter specifications using the sliders. There are five filter specification parameters
is the sampling frequency
is the passband end frequency
is the start of stopband frequency
is the attenuation in db at
is the attenuation in db at 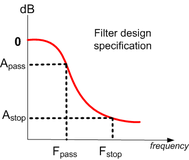
The plot at the top helps you see the locations of these parameters. These are standard digital filter design parameters that can be found in a number of digital signal processing textbooks.
You can do the design using normalized units ( to
to  ) or in Hz. If you select normalized units,
then
) or in Hz. If you select normalized units,
then  corresponds to the Nyquist frequency and
  and
and  will be between
  and
and
 .
.
Next select the analog-to-digital filter mapping method, which can be bilinear or impulse invariance.
Next select the order of the filter. You can select a minimum order to be designed or specify the order
yourself using the slider. The design supports a filter order up to  . Finally, using the pulldown menu,
select the plot type.
. Finally, using the pulldown menu,
select the plot type.
Some inputs will become disabled or enabled depending on what you select for the filter order and for
the units. If you select a specific filter order, then only  will be enabled, as
  is not required in
this case; attenuation input is also disabled in this case, as attenuation
is not required in
this case; attenuation input is also disabled in this case, as attenuation  will be fixed at
 db. If you select normalized units, then the slider
  is disabled, as Nyquist is fixed at
 .
.
The design status is displayed below the main display window. Two possible design errors are detected
and are displayed in red text. The first occurs if the filter order calculated is over  (when you
select minimum filter order). In this case you need to change the design parameters until the
filter order becomes less than
(when you
select minimum filter order). In this case you need to change the design parameters until the
filter order becomes less than  . This error can occur if you select
  much larger than
 .
.
The second error occurs if the gain is found to be too small. This can occur if you select  and
and
 that are too close to each other.
A number of plots are made available to examine different aspects of the final design result, such as the
locations of the poles and zeros, the response of the filter to common test input signals, and the display of
 and
and  in symbolic form.
Due to space limitations, the design is limited to a filter of order  . You can get the design by asking
for a minimum order filter or by specifying the filter order required. Both normalized units and hertz units
can be used in the frequency specification.
. You can get the design by asking
for a minimum order filter or by specifying the filter order required. Both normalized units and hertz units
can be used in the frequency specification.
References
A. V. Oppenheim and R. W. Schafer, Digital Signal Processing, Englewood Cliffs, NJ: Prentice-Hall, 1975, Chapter 5.