My Mathematics 502 (Probability and
Statistics) related material
By Nasser Abbasi
Nov 17,2007
This page will contain collection of statistics related activities I worked on during taking Mathematics 502 at California State Univ. Fullerton in fall 2007. This course is a requirement for the MSc degree in Applied Mathematics and was given by Professor Mortaza (Mori) Jamshidian.
Most of the material is software simulation, some were part of the projects for the course, but most I did on my own.
|
Links |
|||||||||||||||||
|
Mathematica
statistics web page |
See this page |
||||||||||||||||
|
Matlab
related scripts/functions |
|
||||||||||||||||
|
Table of
expected values |
These tables are generated using Mathematica 6.0 They list the probability density function, the
expected value, and the Variance of some common random variables. Also a table of the expected value of some functions of random variables for different distributions. (The html page does not have lines between rows and columns in the table, this is a problem with Mathematica export, trying to resolve) |
||||||||||||||||
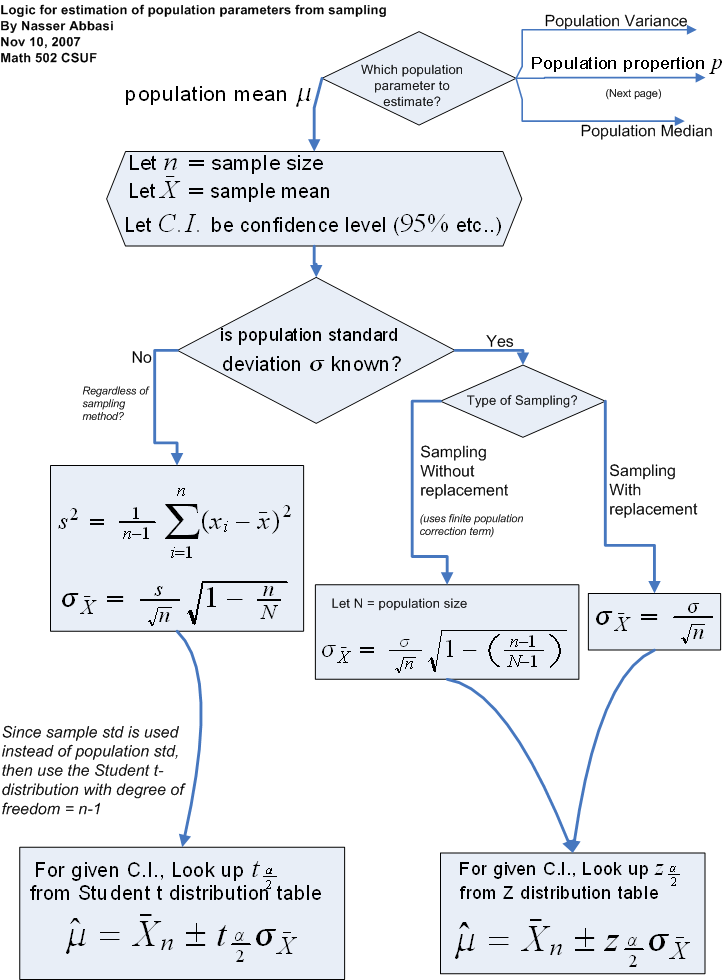
|
Population estimation logic flow charts I found that making flow charts helps me understand things better. So I started making these for parameters estimation problems. |
|
||||||||||||||||
|
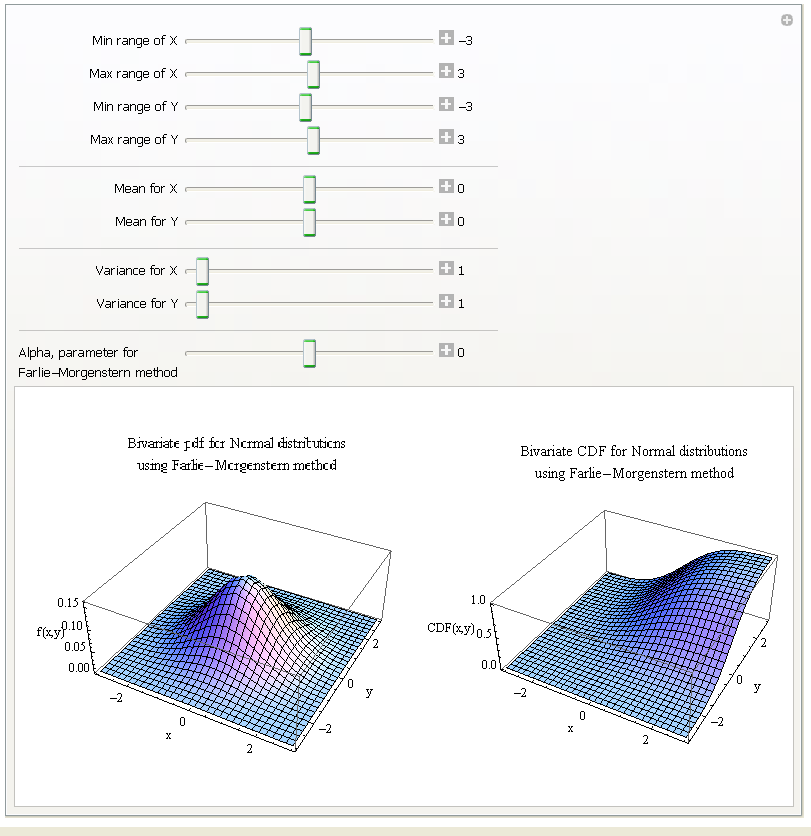
Generating
bivariate normal distribution This simulation was written in Mathematica 6.0. This is simulation of the Farlie-Morgenstern method. The input is the mean and variance of 2 random variables (X,Y) which are supposed to be normally distributed. And also an alpha parameter. The output is a the bivariate joint distribution of these above 2 distributions. |
|
||||||||||||||||
|
A small
note on method of moments, solving using Mathematica |
|