Problem 7.8 part b (corrected)
Nasser Abbasi
Output
» nma_7_8_partb
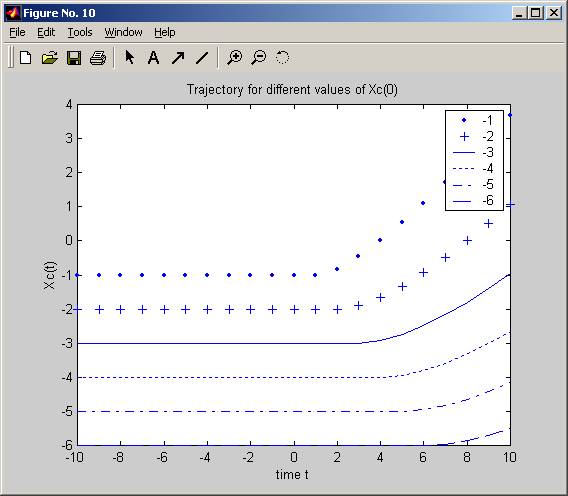
plot trajectories of xc(t) for problem 7.8, part b
Nasser Abbasi
Source code
%
% plot
trajectories of xc(t) for problem 7.8, part b
% Nasser
Abbasi
%
clear all; help nma_7_8_partb;
Vm = 1;
XcV =[-1 -2 -3 -4 -5
-6]; %
some values for Xc(0)
% setup
matrix X where first column has the time value,
% and
second column has Xc(t), i.e. the value of the function
figure;
shapes= struct('name','');
shapes(1).name='.';
shapes(2).name='+';
shapes(3).name='-';
shapes(4).name=':';
shapes(5).name='-.';
shapes(6).name='--';
for(k=1:length(XcV))
Xc = XcV(k);
n=0;
for(t=-10:10)
n=n+1;
x(n,1) = t;
if( t < - Xc/Vm )
x(n,2) = Xc;
else
x(n,2) = Vm*t - 2* real(sqrt(-Xc*Vm*t));
end
end
plot(x(:,1),x(:,2),shapes(k).name);
hold on;
end
title('Trajectory for different values of Xc(0)');
legend('-1','-2','-3','-4','-5','-6');
xlabel('time t');
ylabel('Xc(t)');